QR CODE ANALYTICS & REPORTING
Track Your Audience in Detail with QR Code Scan Analytics
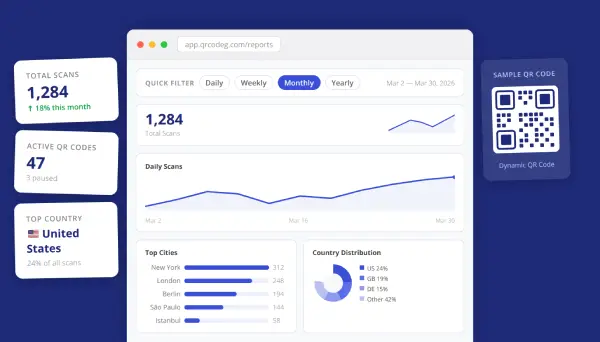
Who scanned, where did they come from, when did they scan? Analyze all your data on a single screen with QR Hits and Scan Summary Reports — and make your next move backed by real data.
QR Scan Analytics
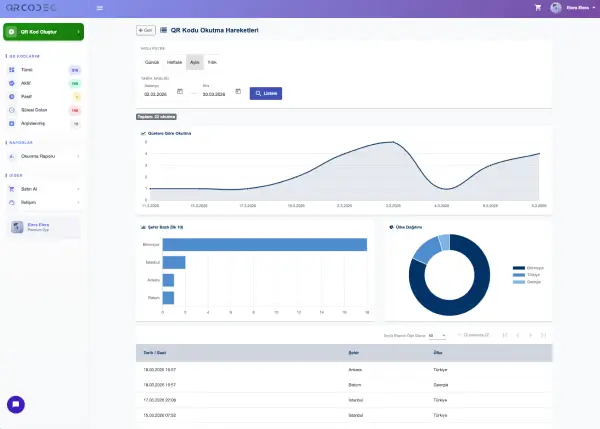
Dive deep into the full scan history, location data, and time distribution of any single QR code.
📅
Date & Time Tracking
See the exact date and time of every scan. Identify which hours of the day drive the most engagement.
🌍
City & Country Breakdown
See the city and country of every scan, record by record. Get a clear picture of your audience’s geographic distribution.
📈
3 Visual Chart Types
A line chart for daily trends, a horizontal bar chart for top cities, and a donut chart for country distribution — all in one screen.
📄
Flexible Pagination
Display 100, 500, or 1,000 records per page. Navigate large scan histories without losing your place.
Scan Summary Report
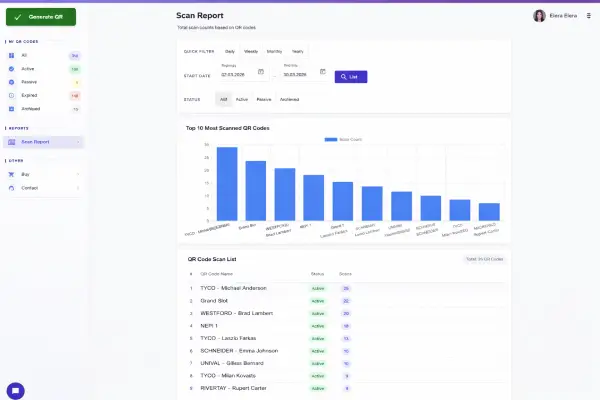
Instead of opening each QR code one by one, compare all the codes in your account on a single screen. See each code’s name, current status, and total scan count side by side. Your top 10 most-scanned QR codes are automatically highlighted in a bar chart — no need to spend hours figuring out what’s working. And when you want to dig deeper into a specific code, jump straight to its QR Hits Report with a single click.
🏆
Top 10 QR Codes
See your 10 best-performing QR codes for any period in a clear bar chart. Identify your star campaigns instantly.
🔗
One-Click Detail View
Click any QR code name in the list to jump directly to its QR Hits Report in seconds.
🔖
Status Filtering
Filter your codes by All, Active, Inactive, or Archived. Focus only on the campaigns that matter right now.
📊
Status & Scan Count Overview
Each code’s name, current status, and total scan count in a single list. Perfect for a quick account-wide review.
Shared Features Across Both Reports
Wondering how a QR code is really performing? The answers are here. See the exact date, time, city, and country of every scan, record by record. Visualize daily trends with a line chart, top cities with a bar chart, and country distribution with a donut chart. With pagination options of 100, 500, or 1,000 records per page, you’ll never feel lost in your data. Use these insights to decide where and when to focus your next campaign.
⚡
Quick Date Filters
Daily, weekly, monthly, and yearly presets for instant filtering. Need a custom window? Pick any start and end date.
📉
Comparative Charts
Rich visual charts in every report. Understand trends at a glance instead of reading through raw numbers.
🔍
Flexible Filtering
Switch between per-code and account-wide views. Status filters let you focus on exactly what you need.
Discover the story your data is telling you
Create a free account, publish your first QR code in minutes, and start accessing your reports right away.